

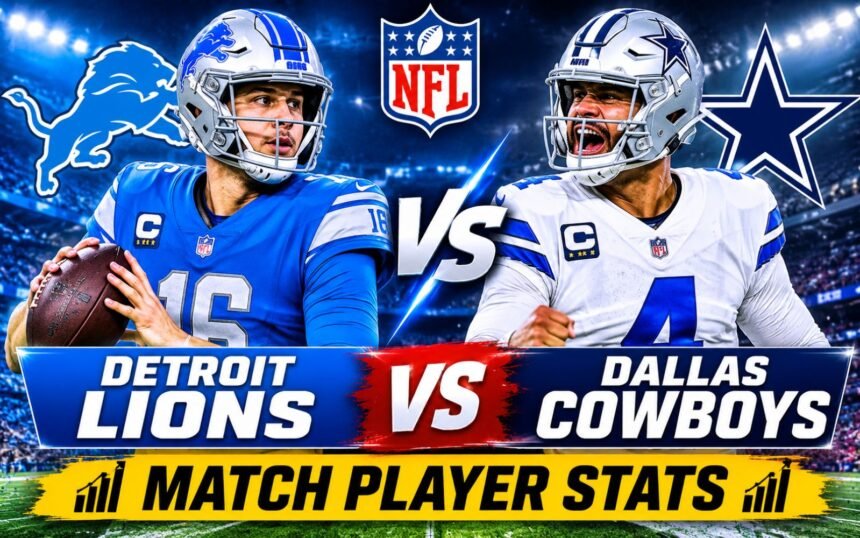
The detroit lions vs dallas cowboys match player stats tell the story of a game in which gaining more yards did not mean playing the more effective football. Detroit beat Dallas 44–30 at Ford Field on Thursday, December 4, 2025, behind three rushing touchdowns from Jahmyr Gibbs, efficient passing from Jared Goff, and a defense that created three takeaways.
Dak Prescott threw for 376 yards, and Dallas produced two 100-yard receivers. Yet the Cowboys could not overcome turnovers, sacks, and too many possessions ending with field goals. Detroit combined offensive finishing with defensive disruption to win the Week 14 matchup.
This guide to the detroit lions vs dallas cowboys match player stats covers passing, rushing, receiving, defense, and special teams, followed by an explanation of what the numbers mean. All game statistics refer to this 2025 regular-season game, unless another date is specified.
Final Score and Game Context
The detroit lions vs dallas cowboys match player stats come from a game that left Detroit at 8–5 and Dallas at 6–6–1. Those were the teams’ records immediately after the game, not their final season records or current standings.
| Team | First quarter | Second quarter | Third quarter | Fourth quarter | Final |
|---|---|---|---|---|---|
| Dallas Cowboys | 3 | 6 | 10 | 11 | 30 |
| Detroit Lions | 10 | 10 | 7 | 17 | 44 |
Detroit led 20–9 at halftime. Dallas rallied after falling behind 27–9, eventually getting within three points in the fourth quarter, but never took the lead.
That sequence provides essential context for the detroit lions vs dallas cowboys match player stats. Dallas spent much of the evening pursuing a deficit, while Detroit repeatedly had opportunities to answer a Cowboys scoring drive. The final margin therefore needs to be read alongside the possession-by-possession swings.
The matchup was competitive deeper into the fourth quarter than the 14-point final margin might suggest. Still, Detroit’s ability to answer Dallas’ comeback attempts prevented the Cowboys from turning offensive momentum into control of the game.
Quarterback Stats: Jared Goff vs. Dak Prescott
Passing Comparison
| Quarterback | Completions/attempts | Passing yards | Passing TDs | Interceptions | Passer rating |
|---|---|---|---|---|---|
| Jared Goff, Detroit | 25/34 | 309 | 1 | 0 | 111.0 |
| Dak Prescott, Dallas | 31/47 | 376 | 1 | 2 | 79.7 |
Goff completed 73.5% of his attempts. Prescott completed 66.0%. Detroit allowed one sack, while Dallas allowed five.
The quarterback section of the detroit lions vs dallas cowboys match player stats favors Goff in accuracy and ball security, even though Prescott led in passing yardage. Goff’s one touchdown pass also understates Detroit’s offensive success because four additional Lions touchdowns came on the ground.
A quarterback does not need several passing scores for his offense to dominate the scoreboard. Moving the ball into scoring position, avoiding negative plays, and letting the running game finish drives can produce an equally valuable result.
Why the Yardage Leader Was Not the Winner
Passing volume is one of the clearest differences in the detroit lions vs dallas cowboys match player stats: Prescott attempted 13 more passes than Goff. More attempts create opportunities for a higher yardage total, but they do not automatically produce a more efficient outing.
Calculations using the detroit lions vs dallas cowboys match player stats put Goff at approximately 9.1 yards per attempt, compared with 8.0 for Prescott. These figures divide passing yards by attempts; they do not subtract sack yardage.
The interceptions also require context. Detroit’s first pick came on a deflected ball, illustrating why a quarterback’s interception total alone cannot assign responsibility for every turnover. Nevertheless, Dallas lost the possession, and Detroit benefited.
For readers comparing the detroit lions vs dallas cowboys match player stats, passer rating summarizes completion percentage, yards per attempt, touchdown rate, and interception rate. It does not directly incorporate sacks, rushing, or starting field position. Goff’s rating advantage is useful evidence, but the full comparison requires those additional details.
Beyond the basic detroit lions vs dallas cowboys match player stats, Dallas’ postgame review documented Goff’s efficiency on quick passes: he completed 17 of 21 for 167 yards and a touchdown. That adds a tactical explanation to the accuracy numbers. Getting the ball out quickly can reduce the time a pass rush has to arrive, although the statistic alone cannot establish why each individual play succeeded. It also shows why an efficient passing attack need not depend entirely on deep throws.
Rushing Stats: Gibbs Scored, Montgomery Supplied the Big Gain
Every Player With a Rushing Attempt
| Team | Player | Carries | Rushing yards | Rushing TDs |
|---|---|---|---|---|
| Detroit | David Montgomery | 6 | 60 | 1 |
| Detroit | Jahmyr Gibbs | 12 | 43 | 3 |
| Detroit | Jameson Williams | 1 | 7 | 0 |
| Detroit | Malik Cunningham | 1 | 1 | 0 |
| Detroit | Jared Goff | 2 | -2 | 0 |
| Dallas | Javonte Williams | 17 | 67 | 1 |
| Dallas | Dak Prescott | 3 | 14 | 0 |
| Dallas | Malik Davis | 3 | 6 | 0 |
| Dallas | KaVontae Turpin | 1 | 4 | 0 |
Detroit finished with 109 rushing yards on 22 attempts. Dallas totaled 91 on 24 attempts.
Gibbs’ Complete Contribution
A rushing-only reading of the detroit lions vs dallas cowboys match player stats misses much of Gibbs’ contribution. He also caught seven passes for 77 yards, giving him 120 yards from scrimmage on 19 touches, alongside his three rushing touchdowns.
To interpret the detroit lions vs dallas cowboys match player stats, it helps to know that “yards from scrimmage” combines rushing and receiving yardage. That measurement is particularly helpful for evaluating a back who contributes through both handoffs and catches.
Gibbs’ rushing and receiving lines in the detroit lions vs dallas cowboys match player stats show why limiting his average gain on carries did not contain his overall production. His performance demonstrates the difference between containing rushing yardage and containing a player’s total impact.
A defense can win several individual rushing downs and still lose the matchup against a versatile back. The relevant questions include where the successful runs occurred, whether receptions extended possessions, and whether the player finished drives.
Montgomery and Javonte Williams Had Different Roles
Montgomery supplied one of the biggest rushing gains in the detroit lions vs dallas cowboys match player stats: a 35-yard run for a second-quarter touchdown. His 60 yards on six carries gave him a 10.0-yard average. Javonte Williams led Dallas with 67 yards and scored its rushing touchdown.
Montgomery’s average reflects a productive evening, but the small workload and long scoring run matter. It should not be interpreted as a prediction of what he would have gained with a much larger number of carries.
Williams’ role in the detroit lions vs dallas cowboys match player stats was to provide Dallas with a rushing foundation, although the Cowboys did not match Detroit’s scoring output on the ground. The difference between the teams was therefore greater near the goal line than the relatively modest gap in total rushing yardage suggests.
Receiving Stats: Lamb Led in Yards, Flournoy Led in Catches
Dallas Cowboys Receiving Numbers
| Player | Targets | Receptions | Receiving yards | Receiving TDs |
|---|---|---|---|---|
| CeeDee Lamb | 8 | 6 | 121 | 0 |
| Ryan Flournoy | 13 | 9 | 115 | 1 |
| Jake Ferguson | 7 | 5 | 58 | 0 |
| George Pickens | 9 | 5 | 37 | 0 |
| KaVontae Turpin | 2 | 2 | 26 | 0 |
| Luke Schoonmaker | 2 | 1 | 12 | 0 |
| Brevyn Spann-Ford | 1 | 1 | 7 | 0 |
| Javonte Williams | 4 | 2 | 0 | 0 |
| Jonathan Mingo | 1 | 0 | 0 | 0 |
The receiving section of the detroit lions vs dallas cowboys match player stats separates targets from catches: a target is a pass directed toward a player, regardless of whether it is caught. The table includes Mingo because he was targeted, although he did not record a catch.
CeeDee Lamb’s Production and Departure
The detroit lions vs dallas cowboys match player stats put Lamb first among all receivers with 121 yards. He left in the third quarter with a concussion and did not return. His final receiving line therefore reflects a shortened appearance.
Lamb’s shortened appearance is essential context for the detroit lions vs dallas cowboys match player stats. The Cowboys lost a receiver who had already delivered substantial production, changing the available options during their comeback attempt.
The injury belongs in the game account, but it should not be used to assert what would have happened had Lamb stayed on the field. Dallas’ actual results can be explained without inventing additional catches, scoring drives, or a different outcome.
Ryan Flournoy’s Role in the Comeback
Flournoy’s line in the detroit lions vs dallas cowboys match player stats includes nine catches on 13 targets for 115 yards and a 42-yard touchdown. He led Dallas in both targets and receptions, while Lamb finished slightly ahead in yardage.
The distinction between those categories helps explain their contributions. Lamb generated more yards per reception; Flournoy handled the larger overall receiving workload.
Flournoy’s touchdown was especially valuable because it helped turn a distant comeback into a close fourth-quarter contest. His reception total also shows that Dallas’ passing production extended beyond its most established names.
Pickens provides a contrasting line in the detroit lions vs dallas cowboys match player stats: five catches for 37 yards. That line describes his production in this matchup; it does not, by itself, prove anything about effort or explain every coverage decision Detroit made.
Detroit Lions Receiving Numbers
| Player | Receptions | Receiving yards | Receiving TDs |
|---|---|---|---|
| Jameson Williams | 7 | 96 | 0 |
| Amon-Ra St. Brown | 6 | 92 | 0 |
| Jahmyr Gibbs | 7 | 77 | 0 |
| Isaac TeSlaa | 2 | 20 | 1 |
| David Montgomery | 1 | 13 | 0 |
| Anthony Firkser | 1 | 7 | 0 |
| Ross Dwelley | 1 | 4 | 0 |
Williams led Detroit in receiving yards, narrowly ahead of St. Brown. TeSlaa caught the Lions’ only touchdown pass.
Detroit’s distribution within the detroit lions vs dallas cowboys match player stats offers a useful example of complementary receiving production. The yardage leader, the touchdown receiver, and the running back providing catches underneath were different parts of the same offense.
St. Brown’s contribution to the detroit lions vs dallas cowboys match player stats came after he missed the week’s practices because of an ankle injury. He finished with 92 yards and contributed a late 37-yard reception that helped set up a touchdown.
That catch illustrates why timing matters alongside totals. A reception that helps protect a narrow fourth-quarter lead can carry significance beyond its contribution to a player’s final yardage.
Defensive Stats: Pressure and Takeaways Changed Possessions
The defensive section of the detroit lions vs dallas cowboys match player stats requires looking beyond Dallas’ yardage production. Detroit’s defensive impact came through disruptive plays that shortened possessions, created favorable opportunities, or ended comeback chances.
| Player | Team | Selected verified contributions |
|---|---|---|
| Jack Campbell | Detroit | 12 combined tackles, 1 sack, 1 forced fumble |
| Al-Quadin Muhammad | Detroit | 3 sacks, 3 tackles for loss |
| Alim McNeill | Detroit | 1 sack |
| Derrick Barnes | Detroit | 1 interception, 23 return yards |
| D.J. Reed | Detroit | 8 combined tackles, 1 interception |
| Brian Branch | Detroit | 1 fumble recovery |
| James Houston | Dallas | 1 sack |
These are selected defensive contributions, not a complete defensive participation table. Combined tackles include solo tackles and assists.
Campbell’s Forced Fumble and Barnes’ Interception
The takeaway sequence behind the detroit lions vs dallas cowboys match player stats began with Campbell forcing a Jake Ferguson fumble that Branch recovered. Detroit converted the ensuing possession into Montgomery’s touchdown.
On Dallas’ first offensive play after halftime, Amik Robertson defended a pass intended for Pickens, and Barnes intercepted the deflection. Detroit then scored through TeSlaa. The Lions turned those two takeaways into 14 points.
Reading the detroit lions vs dallas cowboys match player stats alongside those possessions connects defensive contributions to offensive results without crediting the defense with touchdowns it did not score. Detroit’s offense still had to finish those possessions.
Muhammad’s Sacks Carried Hidden Yardage Value
Muhammad stands out in the detroit lions vs dallas cowboys match player stats with three of Detroit’s five sacks. The Lions’ sacks cost Dallas 50 yards altogether.
Sacks can damage more than a team’s yardage total. They can turn a manageable down into a long-yardage situation, reduce the range of realistic play calls, and move an offense away from the end zone.
The detroit lions vs dallas cowboys match player stats record sacks, but those totals do not capture every pressure or identify every successful block. Even so, the contrast between the protection received by Goff and Prescott helps explain why Detroit could operate more efficiently despite Dallas’ greater passing volume.
Special Teams Stats: Aubrey Kept Dallas Within Reach
Kicking Comparison
| Kicker | Field goals | Extra points | Longest field goal | Points scored |
|---|---|---|---|---|
| Brandon Aubrey, Dallas | 5/5 | 1/1 | 63 yards | 16 |
| Jake Bates, Detroit | 3/4 | 5/5 | 47 yards | 14 |
Aubrey connected from 57, 42, 55, 63, and 29 yards. Bates made kicks from 38, 47, and 46 yards; his other attempt was blocked.
Aubrey’s line in the detroit lions vs dallas cowboys match player stats reflects long-range accuracy that gave Dallas points on possessions that otherwise might have ended without a score. His performance should be separated from the offense’s difficulty reaching the end zone.
The kicking comparison in the detroit lions vs dallas cowboys match player stats also explains the limits of field goals in a high-scoring game. Repeated field goals can preserve a comeback opportunity, but a team surrendering touchdowns needs its offense to finish more drives.
Detroit’s Returns Improved Its Starting Position
Tom Kennedy returned three kickoffs for 120 yards and added a 21-yard punt return. Jacob Saylors supplied 141 yards on five kickoff returns. Dallas’ KaVontae Turpin returned seven kickoffs for 176 yards.
The return figures in the detroit lions vs dallas cowboys match player stats need context because the players had different numbers of opportunities. Kennedy’s kickoff average was 40.0 yards, compared with 28.2 for Saylors and approximately 25.1 for Turpin.
The Cowboys’ postgame statistical review reported Detroit’s average drive starting position at its own 41-yard line.
Return yardage is separate from offensive yardage. Kennedy’s kickoff and punt returns therefore helped Detroit without adding to its 408 yards of total offense. For the same reason, return yards should not be added to a running back’s rushing and receiving totals when reporting yards from scrimmage. Keeping those categories distinct preserves the value of special teams while allowing fair comparisons between offensive players.
Field position gives the detroit lions vs dallas cowboys match player stats another layer of meaning, explaining why total yardage can mislead. A shorter scoring field requires fewer offensive yards. Return production and takeaways can therefore make an offense’s task easier without appearing in its rushing or passing totals.
Team Stats: Why Detroit Won With Fewer Yards
| Category | Dallas Cowboys | Detroit Lions |
|---|---|---|
| Total net yards | 417 | 408 |
| Offensive plays | 76 | 57 |
| Yards per offensive play | 5.5 | 7.2 |
| Net passing yards | 326 | 299 |
| Rushing yards | 91 | 109 |
| Third-down conversions | 6/15 | 3/8 |
| Red-zone touchdowns/trips | 1/3 | 4/5 |
| Turnovers committed | 3 | 0 |
| Time of possession | 31:23 | 28:37 |
Yards per play are rounded to one decimal. Red-zone figures show touchdowns scored on possessions reaching the opponent’s 20-yard line.
Finishing Drives Outweighed Possession Volume
The team comparison accompanying the detroit lions vs dallas cowboys match player stats shows that Dallas held the ball longer and ran more plays. Detroit gained more yards per snap, avoided turnovers, and finished a greater share of its red-zone opportunities.
Those measures answer different questions. Time of possession describes how long a team had the ball. Total plays describe volume. Red-zone conversion measures one part of scoring efficiency.
The detroit lions vs dallas cowboys match player stats need to be evaluated together rather than treating any one measure as a stand-alone verdict. In this game, the combination of efficient gains, favorable field position, and touchdown production carried more weight than Dallas’ modest advantage in total yards.
Detroit also scored on Montgomery’s 35-yard run, which did not require a red-zone snap. Red-zone numbers therefore explain part of the scoring difference, while the complete touchdown picture includes scores originating farther from the goal line.
Individual Passing Yards vs. Team Net Passing Yards
Two figures in the detroit lions vs dallas cowboys match player stats require a distinction: Prescott’s 376 passing yards and Dallas’ 326 net passing yards are both correct. The difference is the 50 yards lost on sacks.
The same calculation applies to Detroit: Goff’s 309 passing yards minus 10 sack yards equals 299 net passing yards.
NFL team offense subtracts sack losses from passing production, while the individual quarterback passing-yardage line does not. Keeping those categories separate prevents a common box-score error and makes the relationship between passing production and total offense easier to understand.
The Fourth-Quarter Plays That Settled the Game
The comeback reflected in the detroit lions vs dallas cowboys match player stats reached a crucial point when Flournoy’s touchdown and a successful two-point pass to Ferguson cut Detroit’s lead to 30–27 with 9:52 remaining.
Detroit answered with a drive ending in Gibbs’ 10-yard touchdown run at 7:17. After Aubrey’s final field goal made it 37–30, the Lions scored again on Gibbs’ 13-yard run with 2:19 left.
Those responses give the detroit lions vs dallas cowboys match player stats important fourth-quarter context and demonstrate Detroit’s closing ability. Dallas applied scoreboard pressure twice, and the Lions produced a touchdown after each threat.
The choice of reference point changes how the ending looks. The final score shows a two-touchdown margin. The fourth-quarter sequence shows Detroit needing to execute with the game still within a single possession.
Reed’s interception on Dallas’ final possession then removed the remaining comeback opportunity. The defense’s last takeaway served a different purpose from its earlier ones: the Lions could protect the lead and finish the game rather than pursue additional points.
How This Game Differs From the 2024 Meeting
Before comparing the detroit lions vs dallas cowboys match player stats with previous meetings, distinguish this game from Detroit’s 47–9 win at Dallas on October 13, 2024. That was a separate game at AT&T Stadium.
In that meeting, Goff threw for 315 yards and three touchdowns, while Prescott finished with 178 passing yards and two interceptions. Detroit outgained Dallas 492–251.
The distinction is substantial. The 2024 result featured a large yardage advantage for Detroit. In December 2025, Dallas narrowly led in total offense, and Detroit’s advantage came through efficiency, turnovers, and scoring execution.
Player tables from those games should never be combined. The date, venue, and final score provide the quickest way to identify which box score a reader is viewing.
Conclusion: Detroit’s Most Valuable Numbers Were Situational
The strongest lesson from the detroit lions vs dallas cowboys match player stats is the value of combining efficient offense with disruptive defense. Gibbs supplied three rushing touchdowns and receiving production, Goff passed accurately, and Detroit changed possessions through pressure and takeaways.
Dallas had substantial production from Prescott, Lamb, Flournoy, and Aubrey. Those contributions kept the contest competitive, but the Cowboys could not match Detroit’s combination of ball security and touchdown finishing.
For readers evaluating this matchup, the most useful approach is to connect each player’s numbers to what happened on the field. Total yardage establishes production; turnovers, field position, and scoring results explain how that production became a 44–30 Detroit victory.
FAQs
1. Who won the Lions vs. Cowboys game on December 4, 2025?
The Detroit Lions won 44–30 at Ford Field in Week 14 of the 2025 NFL regular season. Detroit improved to 8–5, and Dallas fell to 6–6–1.
2. What were Jared Goff’s and Dak Prescott’s passing stats?
In the detroit lions vs dallas cowboys match player stats, Goff completed 25 of 34 passes for 309 yards, one touchdown, and no interceptions. Prescott completed 31 of 47 for 376 yards, one touchdown, and two interceptions.
3. How many touchdowns did Jahmyr Gibbs score against Dallas?
Gibbs scored three rushing touchdowns. He finished with 43 rushing yards and 77 receiving yards, giving him 120 yards from scrimmage.
4. Who led the game in receiving yards?
CeeDee Lamb led with 121 receiving yards. Ryan Flournoy had 115 for Dallas, while Jameson Williams led Detroit with 96.
5. Why did Dallas lose despite gaining more total yards?
The detroit lions vs dallas cowboys match player stats show three Dallas turnovers and touchdowns on one of three red-zone trips. Detroit committed no turnovers and scored touchdowns on four of five red-zone trips.